Dot Quality: The Most Important Inkjet Test That You Probably Aren’t Doing
To date, most of our articles have been focused on evaluating individual aspects of the printing process. We’ve discussed comparing waveforms by studying drop formation and velocity, improving latency by adding a tickle pulse, and determining whether or not to use degassing by measuring dissolved oxygen. We believe that all of these individual tweaks and improvements around the system should result in a better printed product, but how can we take a big picture view and see this? In this article, we will discuss how to evaluate printing performance as a whole, using print quality analysis.
To help explain why periodically taking a step back and evaluating the system as a whole is important, consider the following example. Using a dropwatcher, you’ve noticed that your jetting tends to produce some satellite droplets and you want to see if you can eliminate them. Using what you’ve learned in our post How to Stop Satellites from Ruining Your Print, you spend some time adjusting the ink formulation and the waveform. After a few days, you are able to produce drops that have fewer satellites with no noticeable change in sustainability over time. Pleased with these results, you continue forward to work on another aspect of the project.
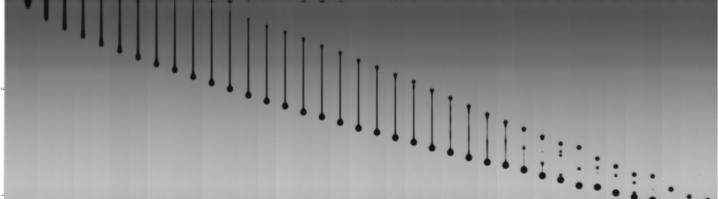
Jetting Before Satellite Optimization
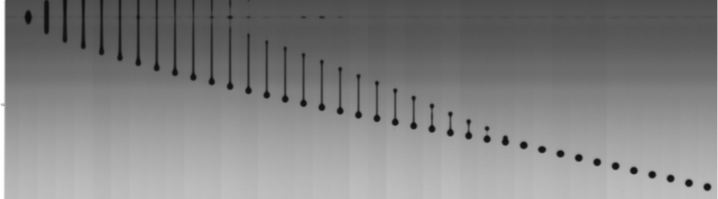
Jetting After Satellite Optimization
After making several other improvements, you are ready for a test run in production. But to your dismay, you discover that the prints are worse than they were before! You’ve improved several individual aspects of the system, but the end result was worse – what happened?
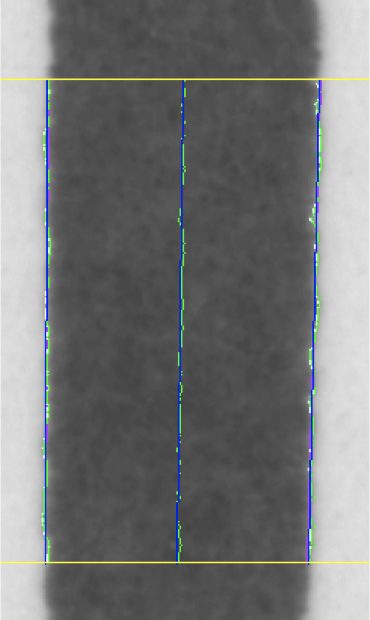
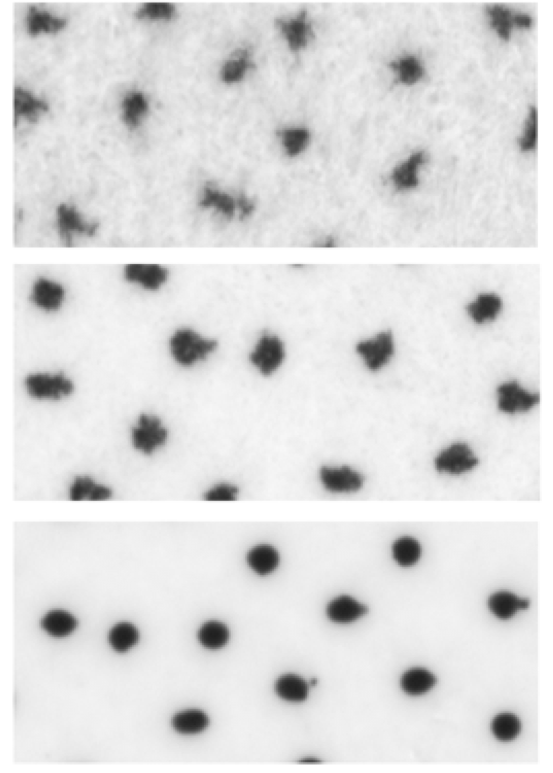
Print Before Reducing Satellites
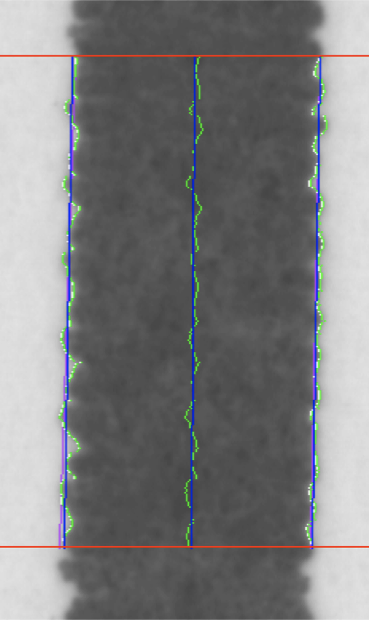
Print After Reducing Satellites
Unknowingly, when you made your changes that decreased the number of satellites, you also decreased the drop velocity by a small amount. When you started printing in production, the slower drops no longer had enough momentum to cover the distance between the printhead and the substrate. The turbulent air inside the system blew them off course before they were able to land in the proper positions. In decreasing the number of satellites on the dropwatcher, you actually turned all the drops into satellites in production. So how do you know what combination is best: fast drops with satellites, slow drops without satellites, or somewhere in between? This scope of this problem is actually even worse, because there are dozens and dozens of interconnected variables inside the printing process where a change in one can set off a chain reaction in the others.
The solution to this problem is to have a consistent testing methodology that you can come back to, that evaluates the entire process as a whole. Something that combines all the little variables into one test, so you can see if all the changes you are making are a net improvement or not. If you had to pick a single test like this, where analyzing one pattern grades everything that is happening inside inkjet printing, that test would have to be Dot Quality.
Learning Something New? Subscribe to Receive Future Articles
The theory behind evaluating Dot Quality is pretty simple to understand. You want to print a grid of dots, where each dot is formed from a single droplet of ink. This grid of dots can span an entire printhead or several printheads. Then, you want to perform measurements on the printed dots to grade them on several key features. Some of the most important features are their size, roundness, whether the edges are smooth or ragged, how dark they are, whether there are missing or extra dots, and the actual positions of the dots compared to the desired ones. With this one test, you are able to evaluate a huge number of aspects of the printer at once.
Using our previous example, how do you determine the right balance of speed and satellites using this test? You can determine if there are extra dots in the grid, which would indicate that the satellites are bad enough that they are showing up in the print. You can determine how much the dot positions deviate from the intended ones. Too much deviation might indicate that your drops are flying off course due to slow speeds, which might show up as banding in your prints. You can manipulate both variables until you find the combination that produces the best result in the Dot Quality test.
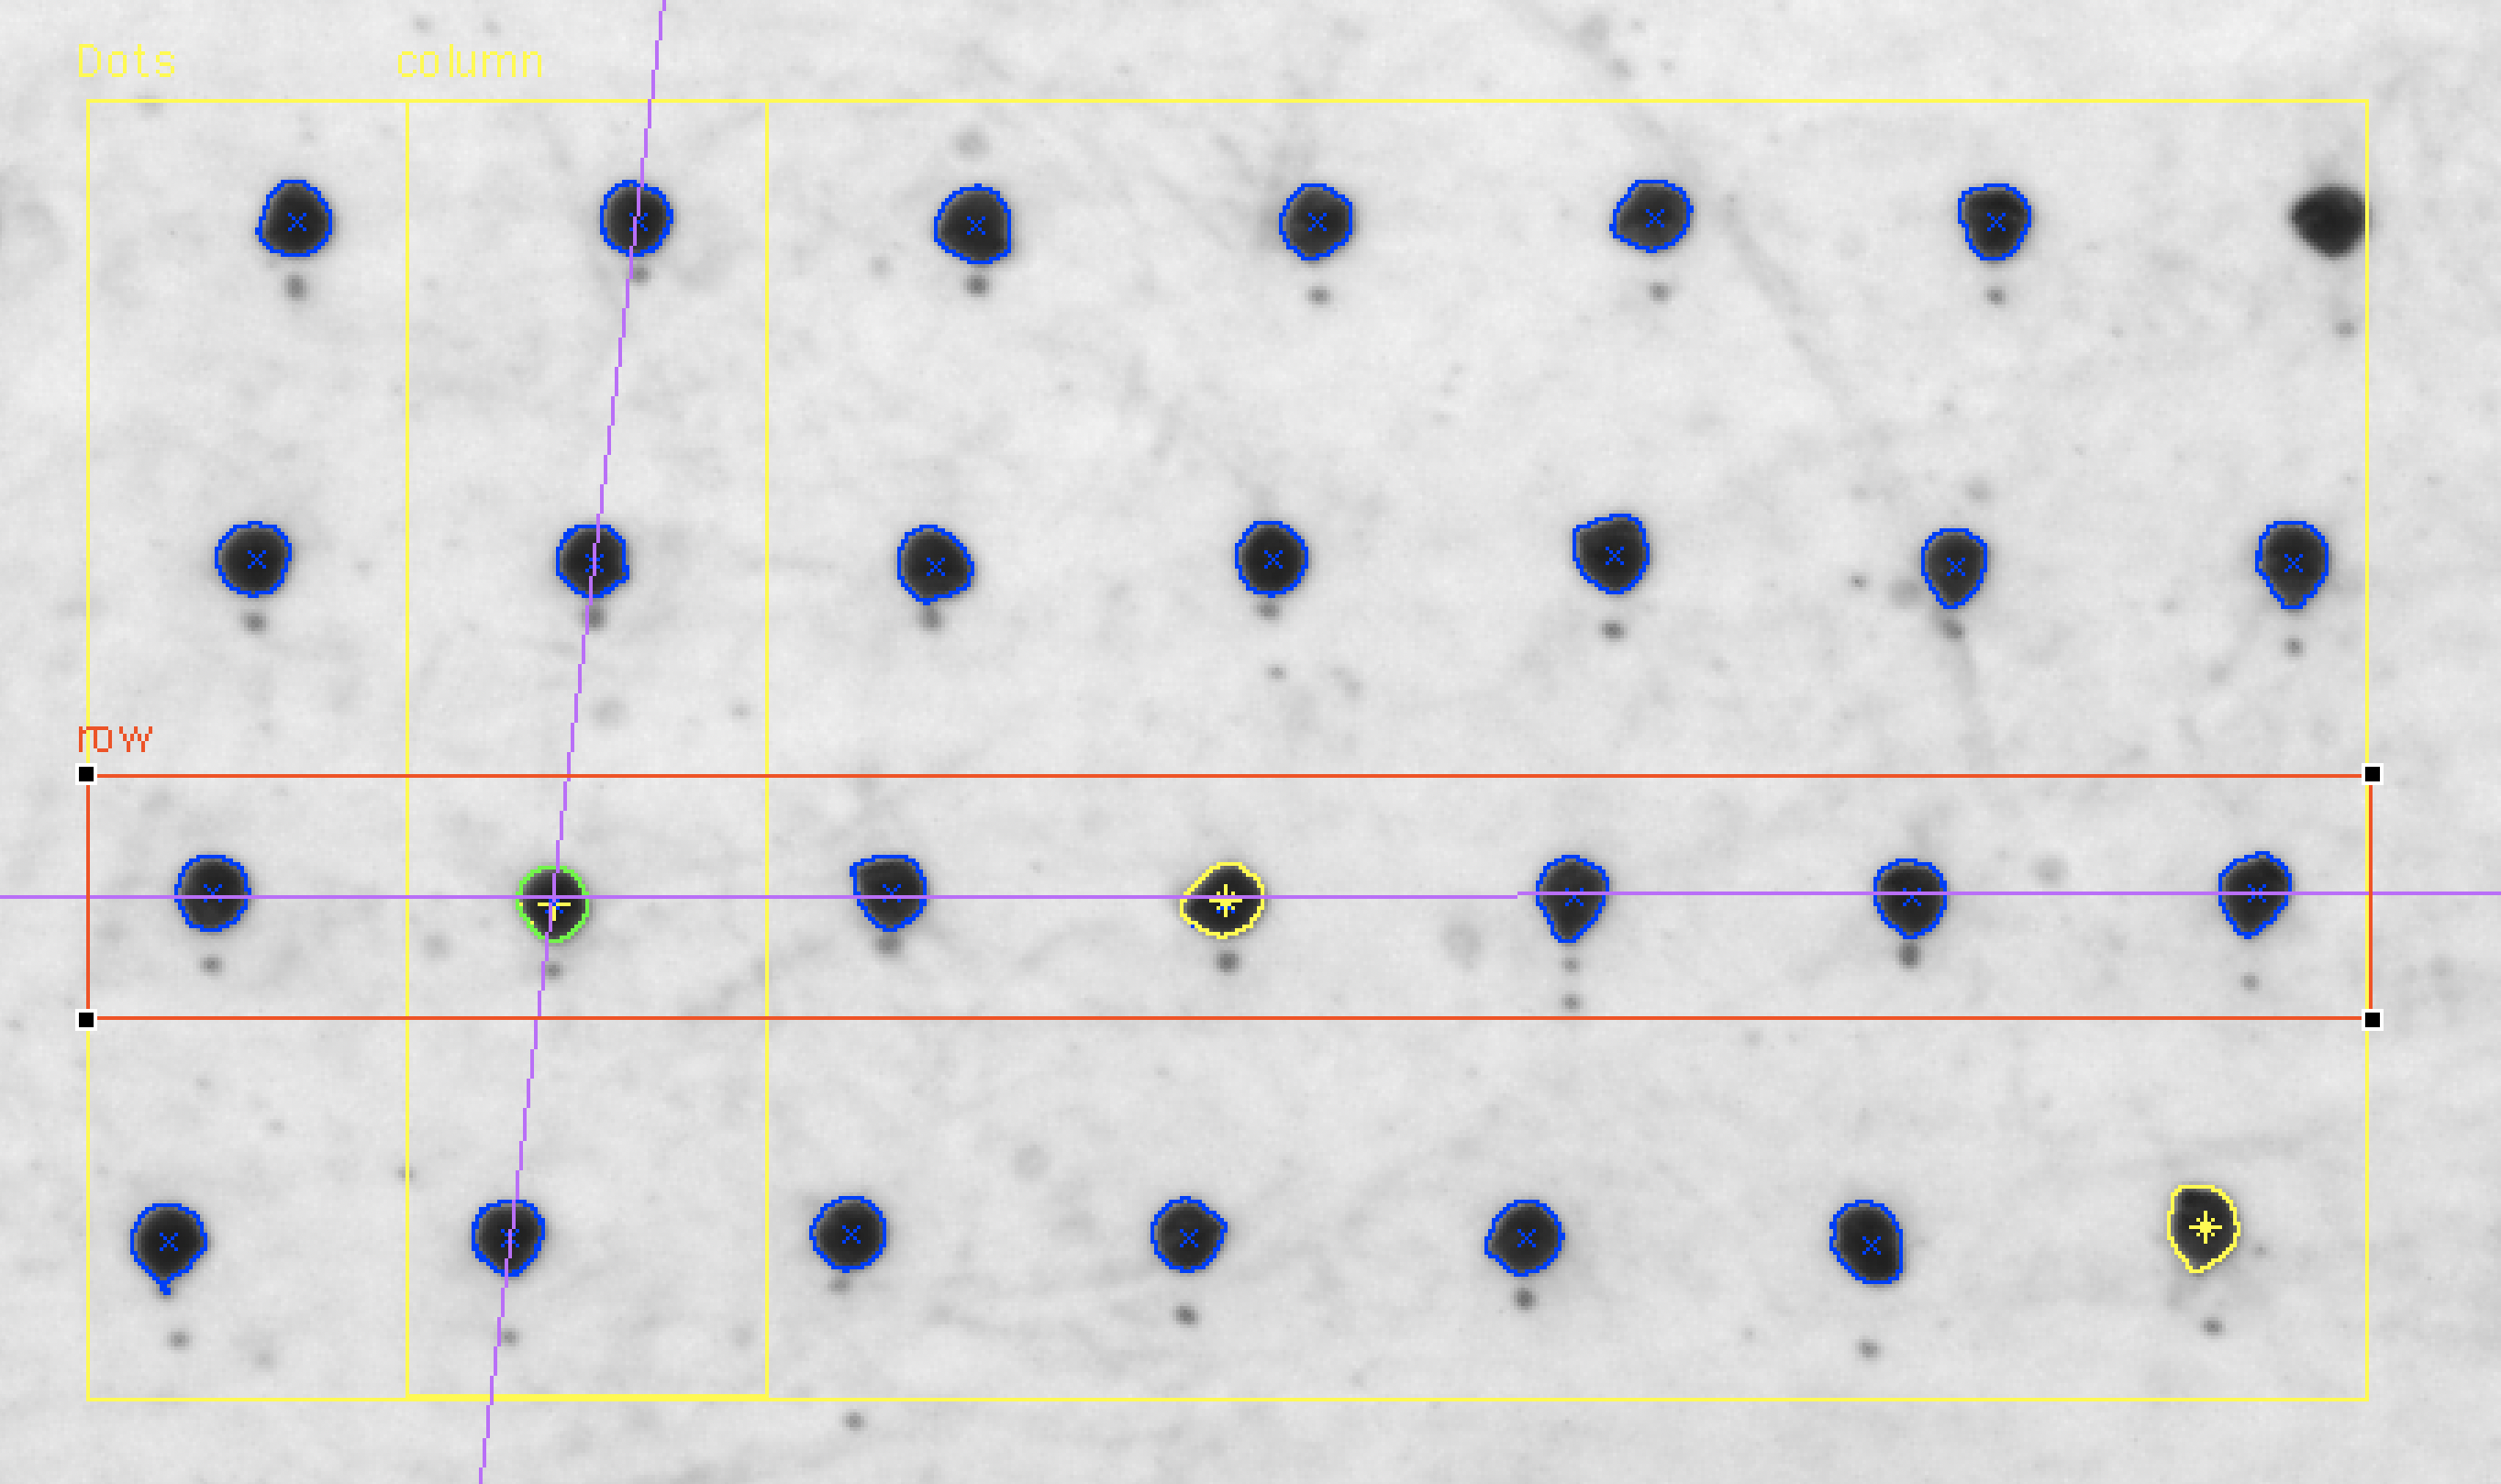
You can also study system design choices beyond jetting using this test. You can compare different substrates and coatings or treatments by studying the size, shape, and edge raggedness of the dots. If the ink is not well matched to the substrate, the dots will have blurred, ragged edges. You can test out the mechanism inside your printer for moving the printhead or substrate by studying how far apart the dots are compared to the intended spacing. In fact, there are only a handful of things that the Dot Quality test does not capture, due to the nature of jetting spaced out dots. Inter-color bleed, mottle, and solid area coverage are some examples of criteria that require additional tests to accomplish.
While the concept of Dot Quality is easily grasped, the ability to actually perform this analysis is a bit more complicated. The first hurdle is that you need a high resolution camera system with proper lighting for your ink and substrate in order to even see an individual printed drop of ink. The second is that you need the high resolution over a wide area, with low distortion, in order to accurately test the whole printhead width or printer. The third is that you need the software and algorithms to get you the data you need. Fortunately, this has been ImageXpert’s specialty for nearly 20 years. We’ve got automated systems of all shapes and sizes for measuring Dot Quality, including ones that are built into the printer itself!
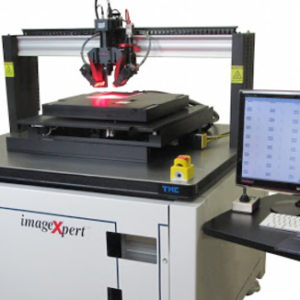
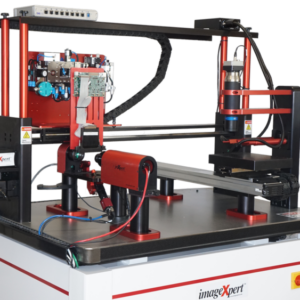
JetXpert Print Station
All-in-one dropwatching, sample printing, and dot quality analysis system for any inkjet printhead
Learn MoreIs Dot Quality analysis, one number to grade a print, worth pursuing? Consider the value of judging the quality of a printed product with a single number. When you are benchmarking a new idea for a process, it allows you to know your competition and set measurable image quality targets. During R&D, it allows you to track overall improvements across many teams working individually to optimize small aspects of the process. And in production, it allows you to track consistency by measuring product quality both inline and offline. Based on our experience, we feel that once you are past the prototyping phase and starting to optimize your printing process, Dot Quality is one of the most important tests that you should be doing.
Referenced Products and Resources
-
Dot Positioning
Learn More -

The Pros Share How to Succeed With Inkjet Additives and Pretreatments
Learn More -
Three-Axis Motion
Learn More